Volume Profile Trading Strategy: Value Area, POC & Shapes
· 8 min read
On this page
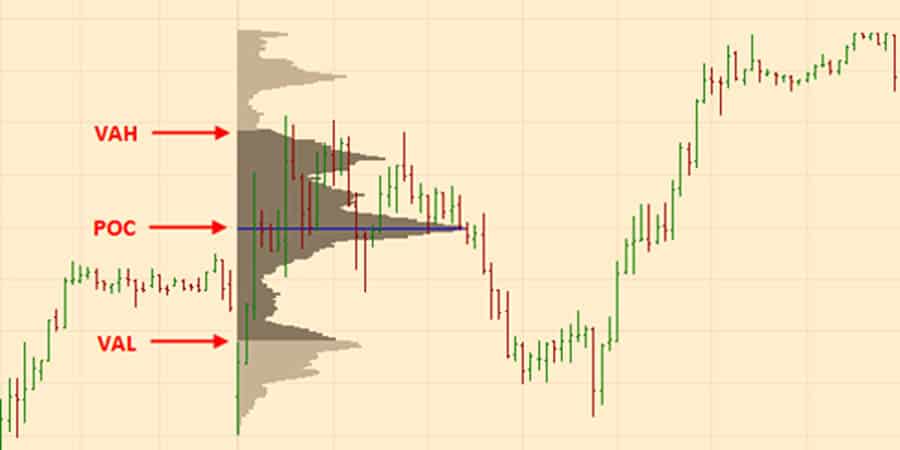
A volume profile trading strategy uses the distribution of traded volume across price — the value area, the point of control, and the profile's shape — to identify where the market accepts value and who is in control. Framing consecutive sessions against each other turns that histogram into a directional read you can trade from.
Most traders load a volume profile indicator, stare at the blob, and go back to trendlines. Fair enough: a single profile in isolation doesn't say much. The professional read comes from comparing profiles. Let's build that skill from the ground up.
The vocabulary: value area, POC and nodes
Four definitions carry the whole methodology:
The value area is the price range containing roughly 70% of the session's volume, bounded by the value area high (VAH) and value area low (VAL). It's where the market did most of its business — accepted value.
The point of control (POC) is the single price with the most traded volume in the profile. It marks the session's fairest price and acts as a magnet while the market stays balanced.
A high-volume node (HVN) is a local bulge of heavy volume — a price area the market liked and will trade around comfortably again.
A low-volume node (LVN) is a thin shelf where little traded — a price area the market moved through quickly and left inefficient.
Everything else in this post is arranging those four objects in time and asking one question: who's winning?
Profile framing: stack the sessions and read the migration
Profile framing means placing daily cash-session profiles side by side and reading how value migrates from one session to the next. It's the volume profile trading strategy in its simplest, most durable form.
Each session's value area building higher than the last: buyers are repeatedly willing to do business at higher prices. The framing is long.
Value building lower day after day: framing is short.
Value overlapping, POCs clustering: the market is balancing, and breakout attempts deserve suspicion until proven otherwise.
Note the logic here. You're not predicting anything — you're observing where two-sided trade actually happened, which is the hardest data in the market to fake. A trapped-looking wick can lie; three consecutive value areas stepping higher can't.
Mark the overlaps. The highest-probability levels come from where one session's value area low overlaps a previous session's value area high. That shelf was the top of accepted value once and the bottom of accepted value later — two independent auctions agreed it mattered. A pullback into that zone with long framing gives you multiple ways to win: the bounce back to the session POC, the rotation back into value, and potentially a continuation leg from the same spot. Watching how sellers behave into such a zone on the footprint — ideally getting absorbed — is how you time the entry.
Profile shapes: D, P and b
The shape of a finished profile summarises the session's auction in one glance:
ShapeWhat it looks likeWhat happenedWhat it favoursD-shapeFat middle, thin extremesBalanced two-way trade; both extremes rejectedMean reversion: fade edges back to POCP-shapeBulge at the top, thin tail belowShort covering / buying imbalance ended in acceptance up highLongs on pullbacks while value holdsb-shapeBulge at the bottom, thin tail aboveLong liquidation / selling imbalance found acceptance lowShorts on rallies while value holds
The D-shape deserves the most respect, because it's the most common and the most abused. A balanced, D-shaped session means the market voted for this range — so momentum probability out of it is low, and the odds favour rotation: bottom of range to POC, POC to value area high, and back. Buying a breakout candle from the middle of a D-shape is exactly the losing pattern we dissect in why most breakouts fail.
P and b shapes are one-sided by construction. They tell you an imbalance already happened; the trade is judging whether the new value holds, not chasing the tail that's already printed.
The composite profile and the elastic band
A composite profile aggregates many sessions — weeks or months — into one distribution. Its job is answering a single question: is current price accepted fair value, or is it stretched?
Think of price as attached to composite value by an elastic band. Price trading inside the composite's value area is business as usual; signals there are about rotation. Price stretched far above the composite value area, on thin volume, is extended — and extension tends to snap back to the mean before any sustained continuation, because there's no built-up acceptance to support trade up there. Every tick higher stretches the band further.
That doesn't mean short every rally. It means: when price is far from composite value, fade-back-to-value setups carry better odds than continuation setups, and when price is inside value, respect the rotation. Direction of the snap-back-then-continue sequence is where a higher-timeframe read helps — if weekly positioning is firmly one-sided (the read our bias dashboard automates from CFTC data), the reversion leg is a pullback to buy, not a trend change.
Low-volume nodes: the market's unfinished business
An LVN is an inefficiency. Price spent almost no time there, so almost nobody's position is anchored there, and the auction never established whether those prices were fair. Markets have a habit of revisiting these thin shelves to rebalance — filling in the missing trade — before moving on.
Practically: mark the LVNs from the cash session and treat them as targets and reaction zones. Price entering an LVN tends to move fast (nothing to slow it down) and then decide sharply at the far side, where the next HVN begins.
Anchored profiles: finding the retest zone after a breakout
When a market breaks out and trends, session profiles lag the story. An anchored profile fixes that. The procedure:
Anchor the profile at the swing low where the move began (for an upside breakout), and end it at the swing high.
Read the distribution of the leg. The heavy-volume area near the base is the accumulation zone — where positions were actually built.
Mark the highest-volume price of that leg. That single level is your primary retest zone: the price the most participants defended on the way up.
Trade the retest, not the chase. Wait for price to return to the zone and watch the flow there. Holders defending their entries show up as passive buying against the pullback.
One caveat that will save your backtests: only use information the profile actually had at the time. Anchoring from a swing low you could only identify in hindsight, at the moment you'd have had to trade, is look-forward bias — the profile looks prophetic in review and useless live. When testing, freeze the anchor at the point it was genuinely identifiable and grade the trade from there.
A daily framing routine
Reading about profiles and actually framing a market every day are different skills. Here's a routine that takes ten minutes before the open:
Pull up the last five cash-session profiles side by side. Ignore the overnight session for framing purposes — the cash session is where the participation that matters happens.
Grade the migration. Value stepping higher, lower, or overlapping? Write it down in one word: long, short, or balanced. This is your session bias, and every intraday setup gets judged against it.
Mark two or three levels, no more. The nearest VAL/VAH overlap, yesterday's POC if it's untested, and the most obvious LVN. A chart with fifteen lines on it is a chart with none.
Decide the playbook before the bell. Balanced framing → fade confirmed extremes toward the POC. Directional framing → wait for the pullback into your marked overlap zone and look for the flow to confirm.
Re-grade at midday. If the open drove price out of yesterday's value and it's staying out, the framing has changed — update the word, update the playbook.
The discipline of writing the one-word bias down matters more than it looks. It stops the mid-session drift where you slowly start trading the opposite of your own morning analysis because the last three candles were exciting.
Do you need expensive data to start?
No. On index futures cash sessions, a tick-based profile and a true exchange-volume profile produce nearly identical distributions — the value areas and POCs land within a few ticks of each other. The histogram's shape is driven by where trade clustered, and both data sources capture that. So a beginner can practise framing, shapes and overlap levels with whatever their platform builds by default, and upgrade data later if the marginal precision starts mattering. (Cash session boundaries shift with daylight saving; our sessions clock keeps the open and close honest.)
Frequently asked questions
What is the value area in volume profile?
The value area is the price range containing roughly 70% of a session's traded volume, bounded by the value area high (VAH) and value area low (VAL). It represents where the market found prices fair enough to do most of its business, making its edges natural decision levels.
What does a D-shaped profile mean?
A D-shaped profile means the session was balanced: most volume traded mid-range around the POC and both extremes were rejected. Momentum probability out of such a session is low, so it favours mean-reversion trades from the edges back toward the point of control rather than breakout trades.
How do you trade the point of control?
The point of control (POC) is the single price with the most traded volume, and it acts as a magnet in balanced conditions. The common play is fading a rejected extreme back toward the POC, or using an old, untested POC from a prior session as a target and reaction level.
Volume profile vs market profile — what's the difference?
Volume profile histograms actual traded volume at each price. Market profile (TPO) counts time spent at each price in 30-minute brackets. Both reveal value areas and balance, but volume profile weights participation while market profile weights time. On liquid index futures they usually agree closely.
Key takeaways
One profile is a picture; stacked profiles are a story. Value migrating higher session over session is long framing, lower is short framing.
Overlaps between one day's VAL and a prior day's VAH are the highest-probability levels the method produces — two auctions agreed on them.
Shape sets the playbook: D-shape favours fading edges back to the POC, P and b shapes favour trading with the established imbalance.
Composite value is the anchor — stretched price tends to snap back to it — and LVNs are the inefficiencies price returns to rebalance.
Trading futures involves substantial risk of loss and is not suitable for every investor. Everything on this page is educational material, not financial advice.